
Figure 1.
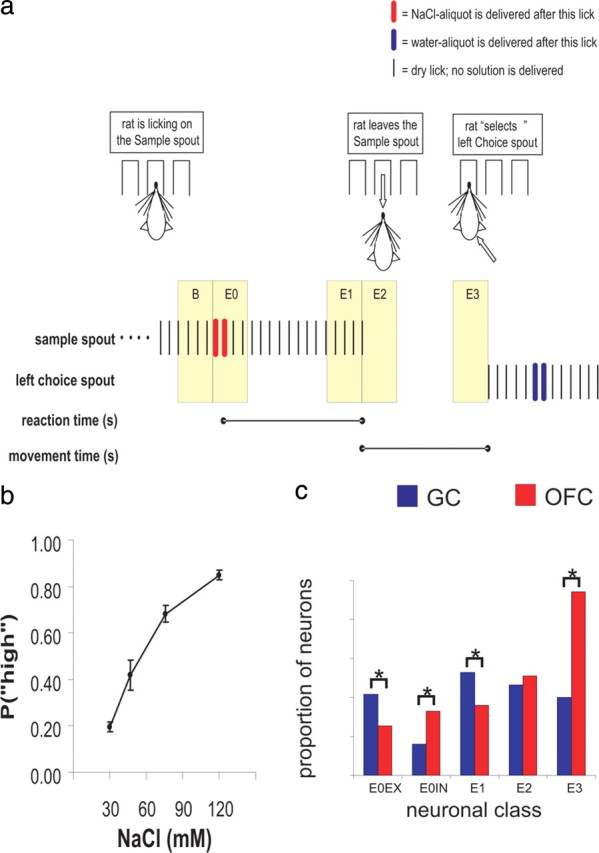
Two-alternative forced choice task. a, An illustration of a trial. Licks on a particular spout are depicted as vertical ticks. Color-coded bars are placed over licks that are followed by solution delivery (red = NaCl, blue = water). RT and MT are indicated by lines that mark their beginning and end and are aligned to the relevant trial events. The Epochs E0–E3 and Baseline (B), each being 500 ms, are highlighted in beige during the trial, and described in the text. The delivery of a particular cue (i.e., a single NaCl concentration) determines which choice response will most likely result in reward. b, This plot depicts the mean probability [P(“high”)], of the rat choosing the High choice spout as a function of NaCl concentration. c, A bar graph showing the relative proportions of event-related neurons from E0–E3 in GC (red) and OFC (blue). A black line that bridges two bars indicates a significant difference (p < 0.05; χ2 test) between the groups represented by each bar.