
Figure 2.
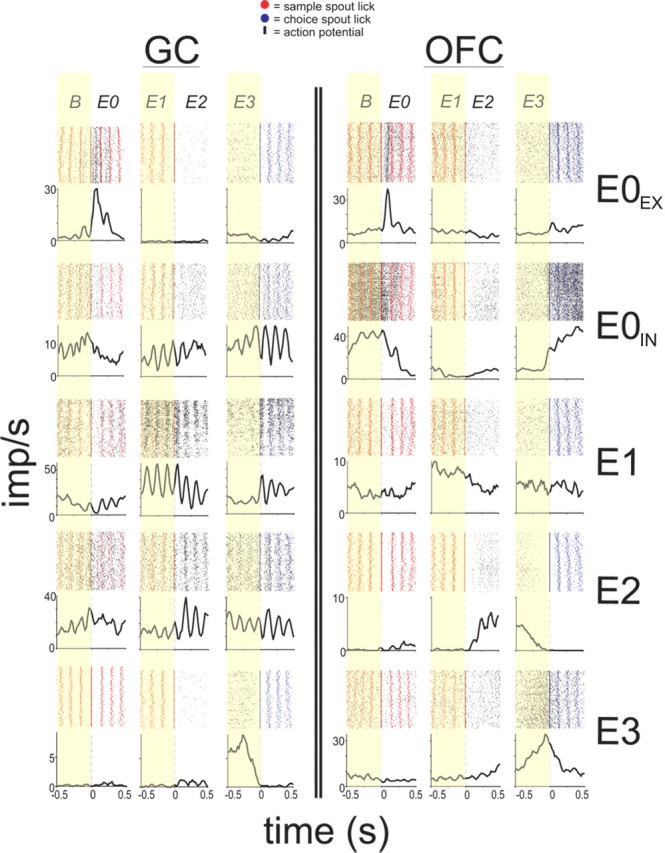
GC and OFC neurons show selective responses during trial-relevant Epochs. The raster plots and PSTHs of representative neurons from five neuron classes. A representative GC and OFC neuron from each class is shown with reference to the Baseline (B) and Epochs E0–E3 as seen in Figure 1a and described in the text. The regions are separated by double black lines. Within each region, a neuron class is represented by a row and each column denotes the trial Epoch (B and E0–E3) to which the PSTH is time-locked. The PSTHs reflect all trials in the session, regardless of response selection.