
Figure 3.
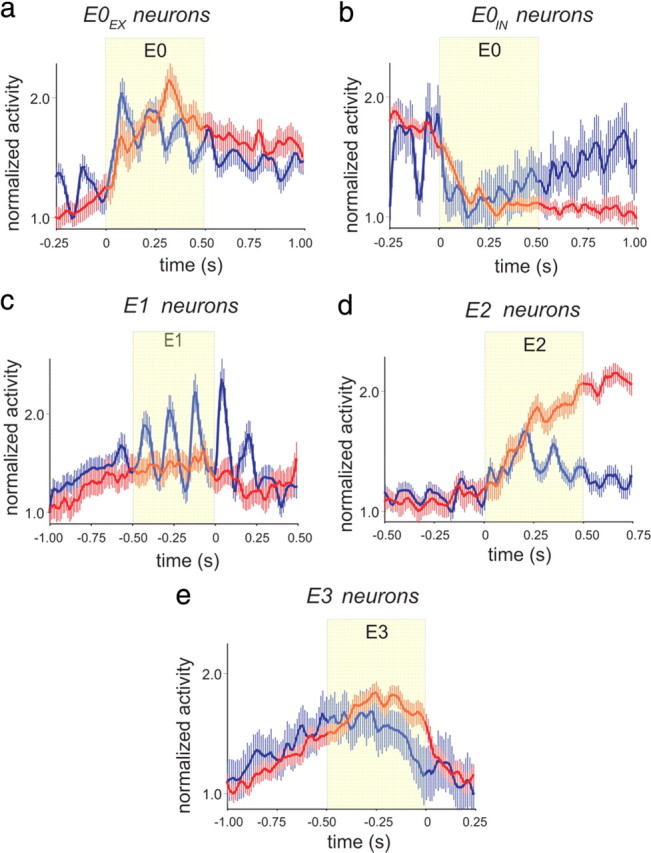
Event-related neurons in GC and OFC. a, Population PSTH (mean ± 99% confidence interval) for E0EX-neurons from GC (red) and OFC (blue) referenced to the start of E0. b, Population PSTH for E0IN-neurons from GC (red) and OFC (blue) referenced to the start of E0. c, Population PSTH for E1 neurons from GC (red) and OFC (blue) referenced to the end of E1 and beginning of E2. d, Population PSTH for E2 neurons from GC (red) and OFC (blue) referenced to the end of E1 and beginning of E2. e, Population PSTH for E3 neurons from GC (red) and OFC (blue) referenced to the end of E3. In all panels data are presented as mean ± 99% confidence interval.