
Figure 4.
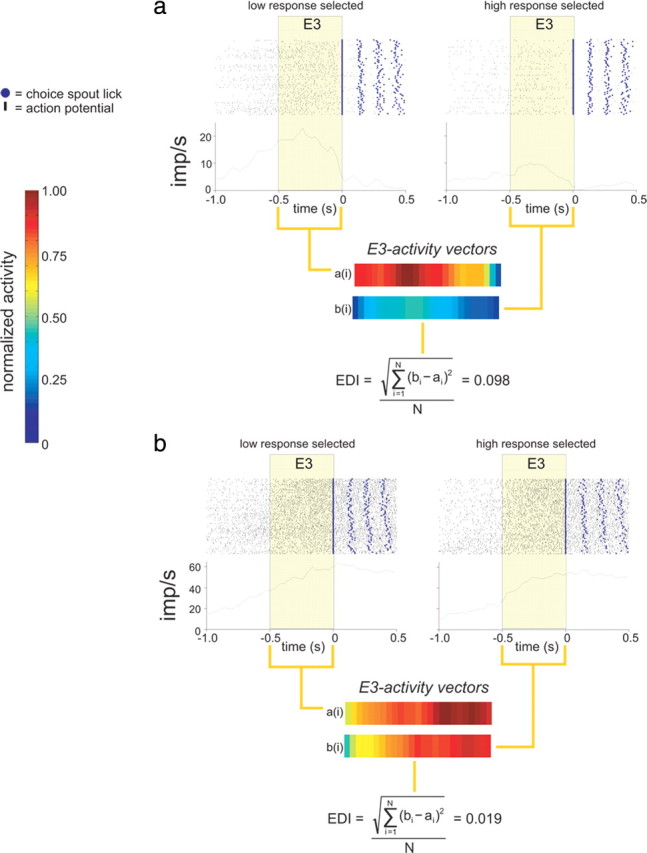
The ensemble discrimination index (eDI) reflects a neuronal population's response selectivity. a, Two PSTHs (20 ms time bins) and associated raster plots are shown for a single OFC neuron under the Low response (left) and High response (right) selection condition. The PSTHs are referenced to the end of E3, which is highlighted in beige. The PSTH during E3 in each response selection condition is converted into a column vector (activity vectors) reexpressing activity as a normalized value between 0 and 1. Each column vector is directly compared using the equation depicted to generate an eDI value = 0.098. b, The same process as described above is performed for a different OFC neuron with an eDI value = 0.019, indicating the response is more similar to that than the neuron's response depicted in a.