
Figure 5.
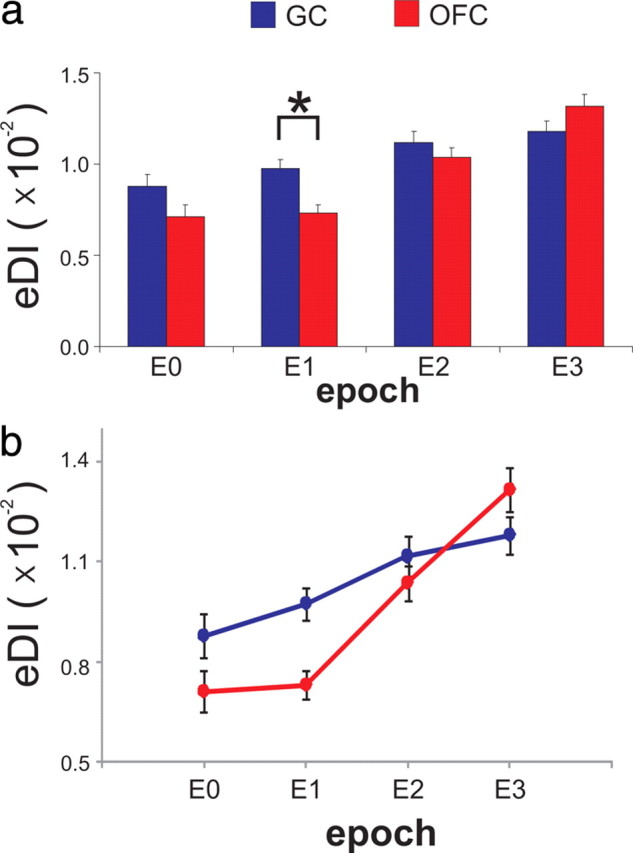
The ensemble discrimination index (eDI) increases from E0 to E3. a, The eDI (mean ± SEM) for E0–E3 as a function of region. b, The eDI for E0–E3 for data in a displayed as a line-plot to better illustrate the eDI increase across Epochs and regions.