
Figure 8.
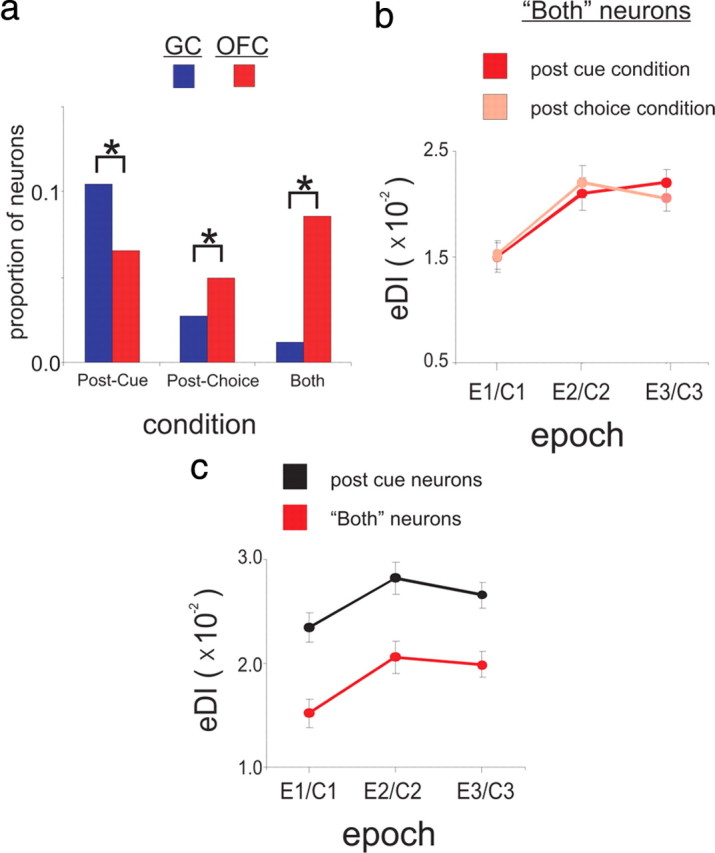
The OFC contains three distinct neuronal ensembles that are differentiated by when they become active in relation to the Choice response. a, A bar graph showing the relative proportions of neurons active in the Post-Cue (left), Post-Choice (center), or Both (right) conditions in GC (red) and OFC (blue). A black line that bridges two bars indicates a significant difference (p < 0.05; χ2 test) between the groups represented by each bar. b, The eDI (mean ± SEM) for OFC Both neurons during the Post-Cue (light blue) or Post-Choice (dark blue) condition and as a function of Epoch (where we assumed E1 C1, E2C2 and E3C3 for the analysis). c, The eDI (mean ± SEM) for OFC Both neurons (light blue—see text) and OFC Post-Choice neurons (black—see text) only during the Post-Choice condition and expressed as a function of C1–C3.