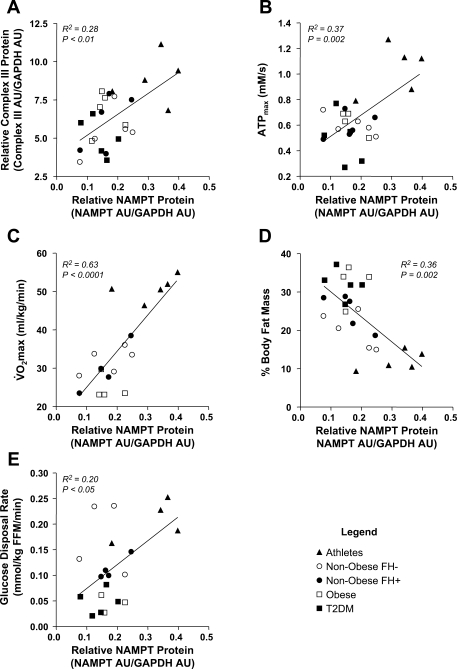
Fig. 2.
Relationship between skeletal muscle NAMPT protein and markers of mitochondrial content and function. A: Spearman correlation between NAMPT and complex III protein expression in skeletal muscle (n = 25, R2 = 0.28, P < 0.01). B: Pearson correlation between skeletal muscle NAMPT protein expression and ATPmax (n = 24, R2 = 0.37, P = 0.002). C: Pearson correlation between skeletal muscle NAMPT protein expression and V̇o2max (n = 18, R2 = 0.63, P < 0.0001). D: Spearman correlation between skeletal muscle NAMPT protein and %body fat mass (n = 24, R2 = 0.36, P = 0.002). E: Spearman correlation between skeletal muscle NAMPT protein and glucose disposal rate (n = 20, R2 = 0.20, P < 0.05).

