Fig. 5.
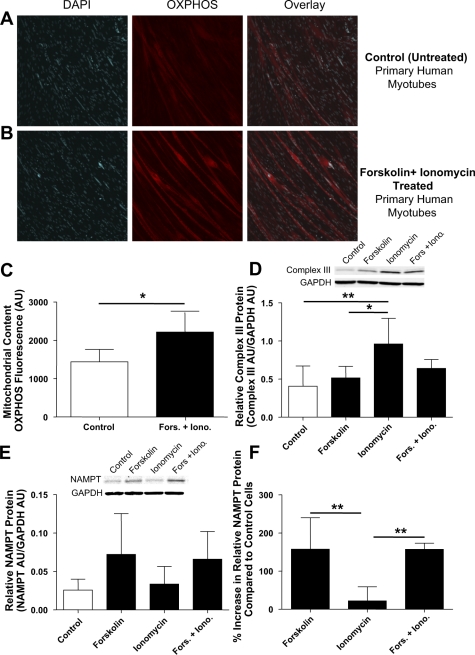
NAMPT protein expression and mitochondrial content in forskolin- and/or ionomycin-treated primary human myotubes. DAPI staining of nuclei and OXPHOS staining of mitochondria and overlay in control (untreated; A) and forskolin- and ionomycin-treated primary human myotubes (B). C: quantification of mitochondrial volume by OXPHOS fluorescence (means ± SD, n = 4, paired Student's t-test, P < 0.05) in control and forskolin- and ionomycin-treated cells. D: complex III protein in control and forskolin- and/or ionomycin-treated primary human myotubes (means ± SD, n = 5, one-way ANOVA with Dunnett post hoc test, *P < 0.05, **P < 0.01). E: NAMPT protein in control and forskolin- and/or ionomycin-treated primary human myotubes [means ± SD, n = 5, one-way ANOVA with Dunnett's post hoc test, not significant (NS)]. F: %increase in NAMPT protein vs. control cells (means ± SD, n = 5, one-way ANOVA with Tukey's post hoc test, **P < 0.01).

