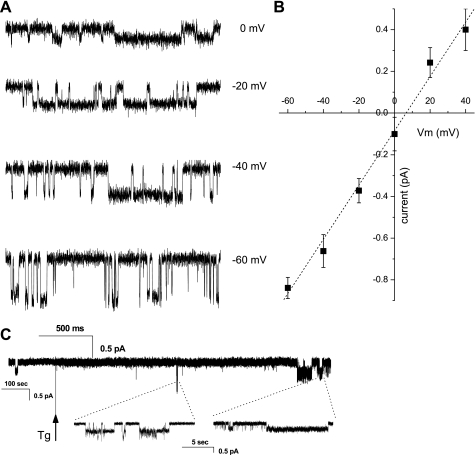
Fig. 3.
Ca2+ currents in cell-attached patches. A: series of traces showing typical single-channel currents in TRPC1+/+ cells in cell-attached configuration at indicated voltages that were not observed in TRPC1−/− cells. B: current-voltage relationship of TRPC1 channel (n = 7). C: sample trace showing Ca2+ current evoked in response to sarcoplasmic reticulum (SR) emptying by thapsigargin (Tg). Patch was held at −40 mV and first basal activity was acquired, followed by the application of thapsigargin-containing solution, as indicated by vertical arrow.

