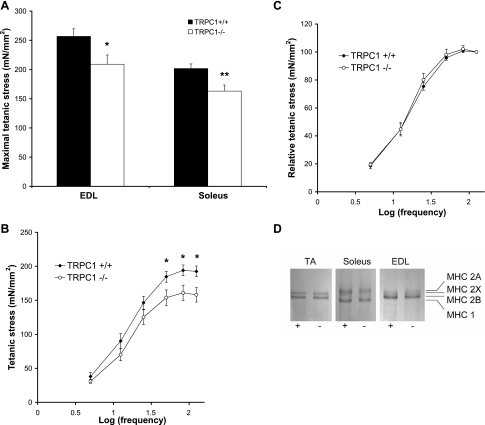
Fig. 4.
Loss of TRPC1 induces a reduction of force production. A: maximal stress (force per cross-sectional area) developed during a 300-ms tetanus stimulated maximally (125 Hz). *P < 0.05 vs. TRPC1+/+; **P < 0.01 vs. TRPC1+/+ (Student's t-test, n = 9). B and C: stress vs. stimulation frequency relationship in soleus muscles. *P < 0.05 vs. TRPC1+/+ (Student's t-test, n = 9). D: SDS-PAGE analysis of myosin heavy chain (MHC) isoforms of TA, soleus, and EDL muscles from TRPC1+/+ (+) and TRPC1−/− (−) mice.

