Fig. 6.
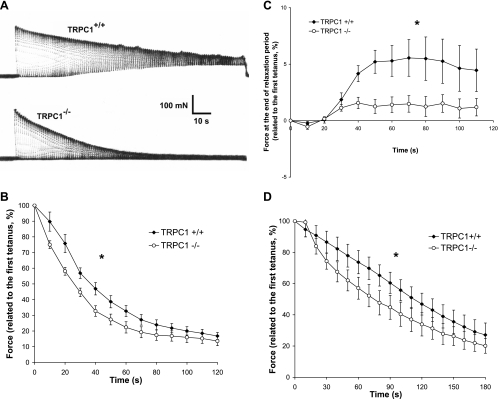
Involvement of TRPC1 in muscle fatigue: mechanical data. A: representative examples of force records in soleus muscles from TRPC1+/+ and TRPC1−/− mice: tetani of 500 ms every s during 2 min at 50-Hz stimulation frequency. B: quantification of the loss of force during the protocol of fatigue in soleus muscle (force measured every 10th tetanus). Results are expressed relative to the maximal force produced during 1st tetanus. Statistical analysis : *TRPC1+/+ curve (n = 10) different from TRPC1−/− curve (n = 12), P < 0.05, 1-way repeated-measures ANOVA. C: quantification of the force at the end of the relaxation period (0.5 s). Results are expressed relative to the maximal force produced during 1st tetanus. Statistical analysis: *TRPC1+/+ curve (n = 10) different from TRPC1−/− curve (n = 12), P < 0.05, 1-way repeated-measures ANOVA. D: loss of force during the protocol of fatigue in EDL muscle. Statistical analysis: *TRPC1+/+ curve (n = 7) different from TRPC1−/− curve (n = 7), P < 0.05, 1-way repeated-measures ANOVA.

