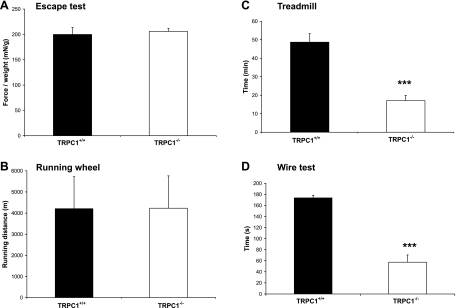
Fig. 8.
In vivo testing. A: escape test: whole body force developed in response to a stimulus (gentle pinching of the tail). Procedure was repeated at short intervals for 2.5 min. Results are presented as means of the 5 highest peaks of force recorded, relative to body weight (mN/g) (n = 10 for each strain). B: running wheel: spontaneous running activity measured during the active part of the day (n = 11 for each strain). C: forced treadmill exercise: duration of exercise before exhaustion. ***P < 0.001 vs. TRPC1+/+ (Student's t-test, n = 10) D: wire test: mice were suspended from a horizontal metallic wire. Time until mice completely released their grasp and fell down is shown; scores of the 3 trials were averaged. ***P < 0.001 vs. TRPC1+/+ (Student's t-test, n = 10).

