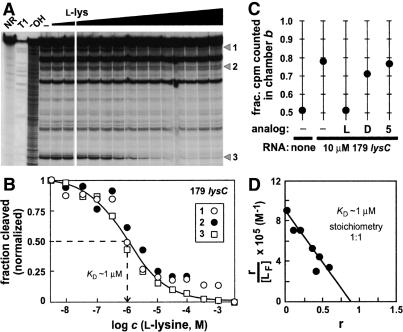
Figure 4.
Determination of the dissociation constant and stoichiometry for L-lysine binding to the 179 lysC RNA. (A) In-line probing with increasing concentrations of L-lysine ranging from 3 nM to 3 mM. Details are as defined for Figure 2C. (B) Plot depicting the normalized fraction of RNA undergoing spontaneous cleavage versus the concentration of amino acid for sites 1-3. The broken line identifies the concentration of L-lysine required to bring about half-maximal structural modulation, which indicates the apparent KD for ligand binding. (C) The 179 lysC RNA (10 µM) shifts the equilibrium of tritiated L-lysine (50 nM) in an equilibrium dialysis chamber. To investigate competitive binding, unlabeled L-lysine (L), unlabeled D-lysine (D), or L-ornithine (5) was added to a final concentration of 50 µM each to one chamber of a pre-equilibrated assay as indicated. (D) Scatchard analysis of L-lysine binding by the 179 lysC RNA. The variable r represents the ratio of bound ligand concentration versus the total RNA concentration, and the variable [LF] represents the concentration of free ligand.

