


Figure 2.
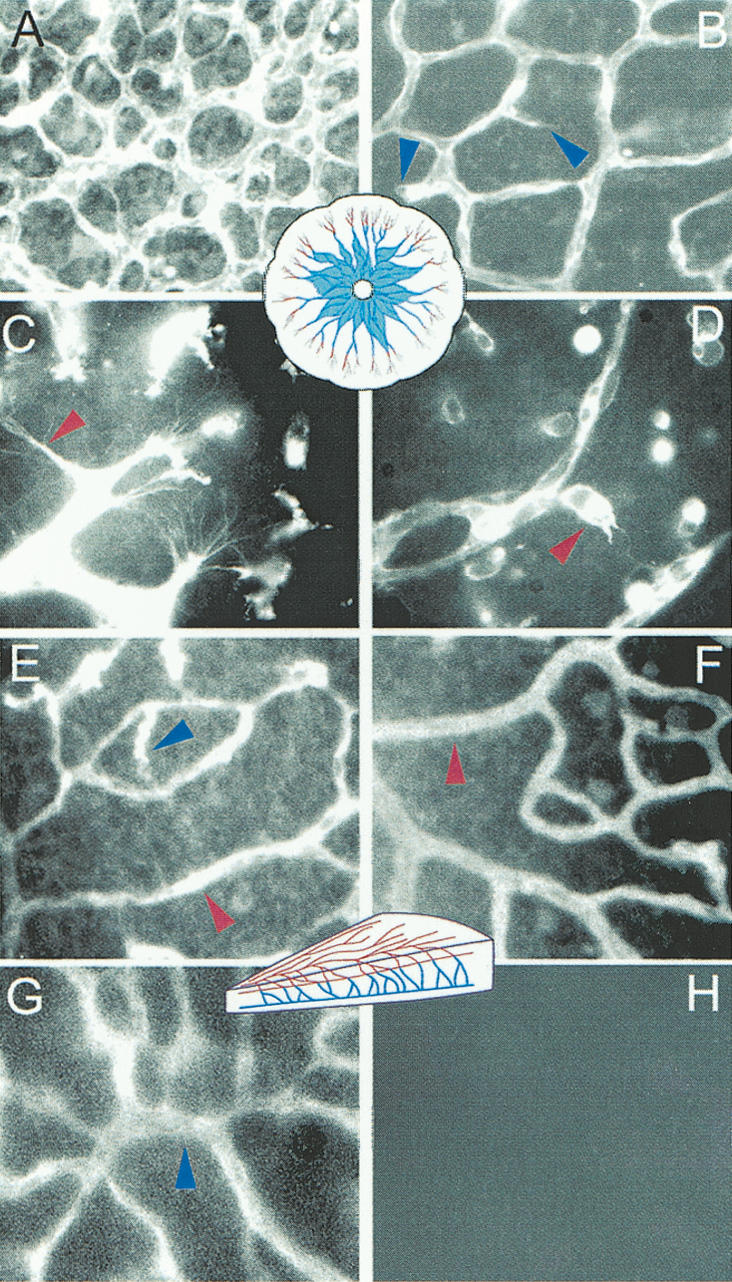
FTI inhibits developmental retinal angiogenesis. Panels A-D show effects of FTI on blood vessels in the P4 retina. (A,C) DMSO treated animals. (B,D) Effects of FTI on the plexus and sprouts. Diagrammatic representations of the retinal vessels at the stage analyzed are shown in the center of the relevant panels and are color-coded to match arrows used to indicate the location of the blood vessels shown in higher magnifications. (A,B) Low-power images of the blood vessels show alterations in vessel density between controls (A) and FTI-treated animals (B). Blue arrows highlight aborted sprouting, which in one case contains erythrocytes that have become lodged in the “dead end” vessel. (C,D) In high-power images of vessel tips we have used red arrows to highlight the dramatic morphological alterations between the normal subcytoplasmic projections that occur during sprouting in control retinas (C) and the misshapen sprouts in the FTI-treated animals (D). E-H illustrate that the formation of the second layer of retinal blood vessels depends on sprouting from the first layer and is entirely eliminated by FTI treatment between P8 and P11. Again, a schematic drawing of this stage color codes the older vessels (red) and the sprouting vessels (blue). The first layer of vessels, which was formed before FTI treatment in control animals (E), and in FTI-treated animals (F) are not dramatically altered. Yet, the second vessel layer that forms during P8-P11 (G) is completely prevented by FTI treatment (H).