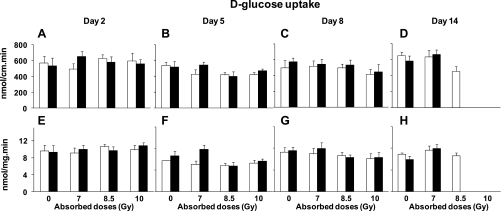
Fig. 5.
Proximal intestinal d-glucose uptakes per centimeter at days 2 (A), 5 (B), 8 (C), and 14 (D) postirradiation and uptake per milligram at days 2 (E), 5 (F), 8 (G), and 14 (H) postirradiation at different absorbed doses. Results are means ± SE of 6 independent experiments. See text for P values of two-way and one-way ANOVAs. There were similar trends in radiation-induced reductions of d-glucose uptake per centimeter and per milligram.

