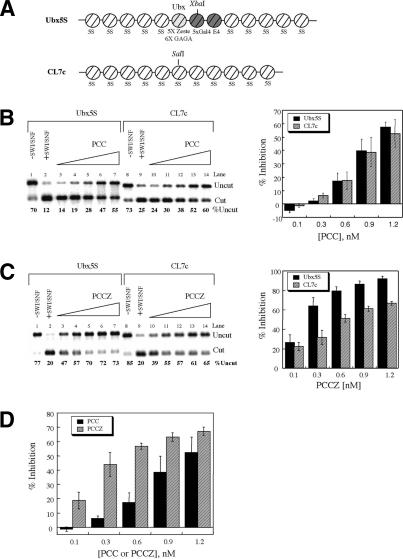
Figure 3.
PCC-Z more effectively inhibits chromatin remodeling on arrays with and without Zeste binding sites. (A) Schematic representation of the nucleosomal arrays used in this assay, Ubx5S and CL7c (see text for description). (B,C) Products of digestion with either XbaI (Ubx5s, black bars) or SalI (CL7c, hatched bars) after incubation with increasing amounts of PCC (B) or PCC-Z (C) and SWI/SNF. Controls are as in Figure 2B. Representative gels are shown. Data are represented as percent inhibition and represent data from at least three experiments. (D) Data from B and C plotted together to highlight the enhanced repressive activity of PCC-Z (hatched bars) as compared with PCC (black bars) on CL7c arrays, which do not have zeste binding sites.

