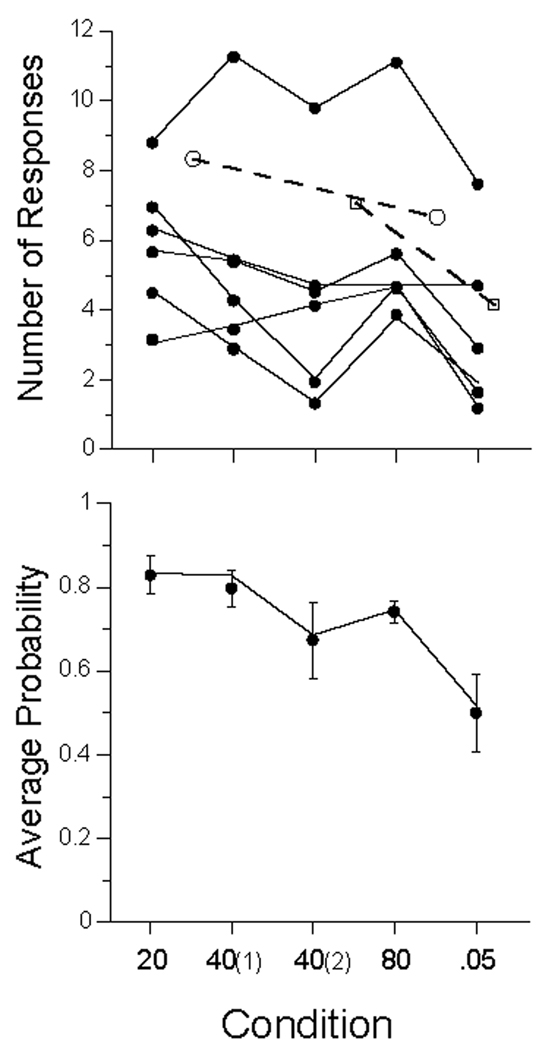
Figure 1.
Data from Experiment 1. Top Panel: average number of responses per trial (dots) for each subject., ranging from Pigeon 106 (top curve) to Pigeon 105 (bottom in condition 20). Open symbols represent data from Perkins and associates (1975). Bottom panel: Average probability of making at least one response on a trial averaged over pigeons; bars give standard errors. Unbroken lines in both panels are from the MP model, described later in the text.

