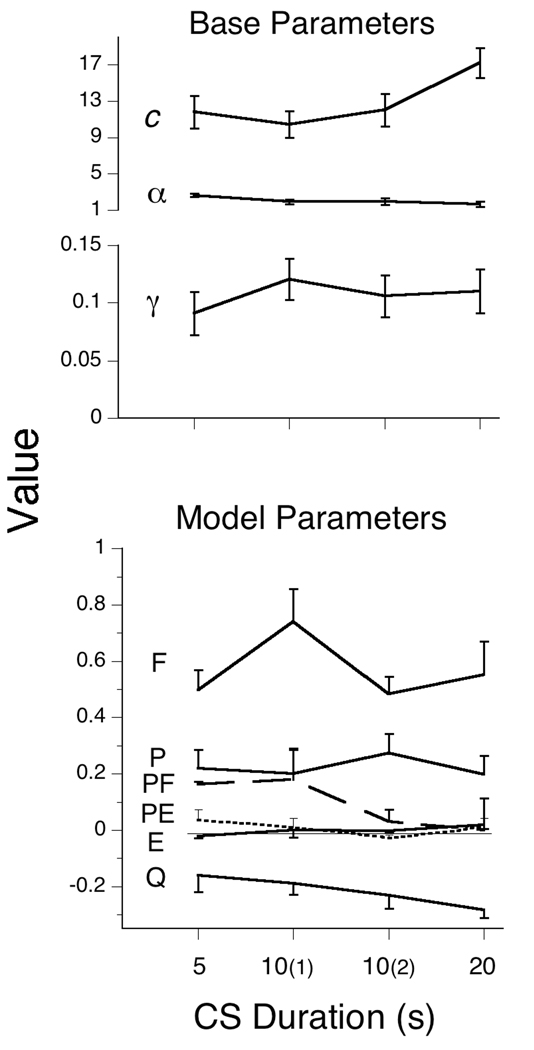
Figure 10.
The average parameters of the Base and MPS models for Experiment 2. The conditions are identified by their trial duration, with the first and second exposure to the 10s ITI noted parenthetically. The same Weibull parameters, c and α, were used for both models. The error bars delimit the SEMs. πPF is traced by a dashed line, and πPE by a dotted line.

