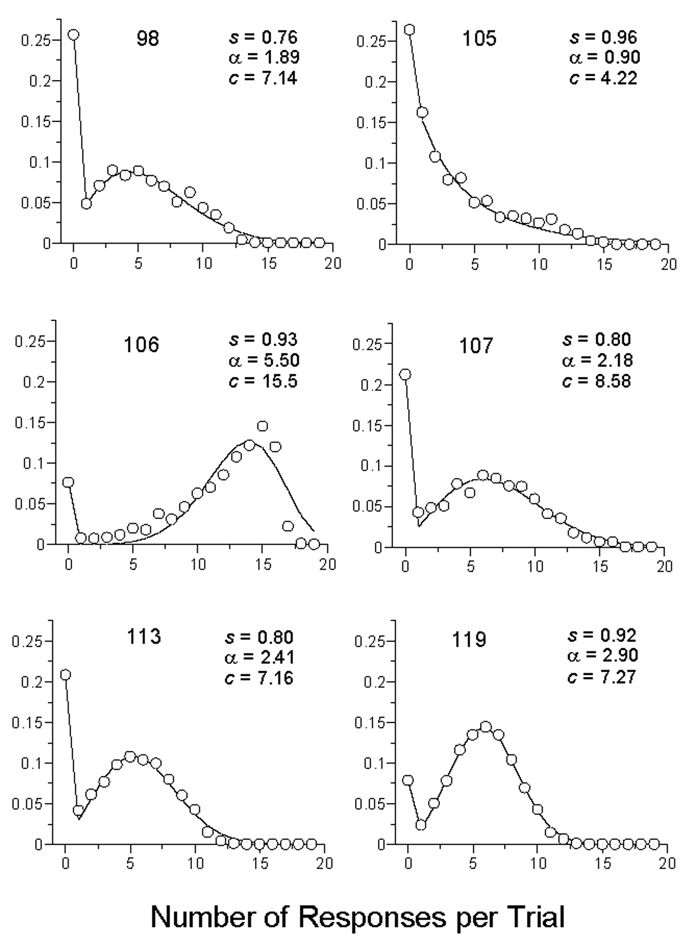
Figure 3.
The relative frequency of trials containing 0, 1, 2, … responses. The data are from all trials of the first condition of Experiment 1. The curves are drawn by the Weibull response rate model (Equation 1). The parameter s is the probability of being in the response state; the complement of this probability accounts for most of the variance in the first data point. The parameter α dictates the shape, from exponential (α = 1) to approximately normal (α ≈ 3) to increasingly peaked (α ≈ 5). The parameter c is proportional to the mean number of responses on trials in the response state, and gives the rank order of the curves in Figure 1 at condition 20.

