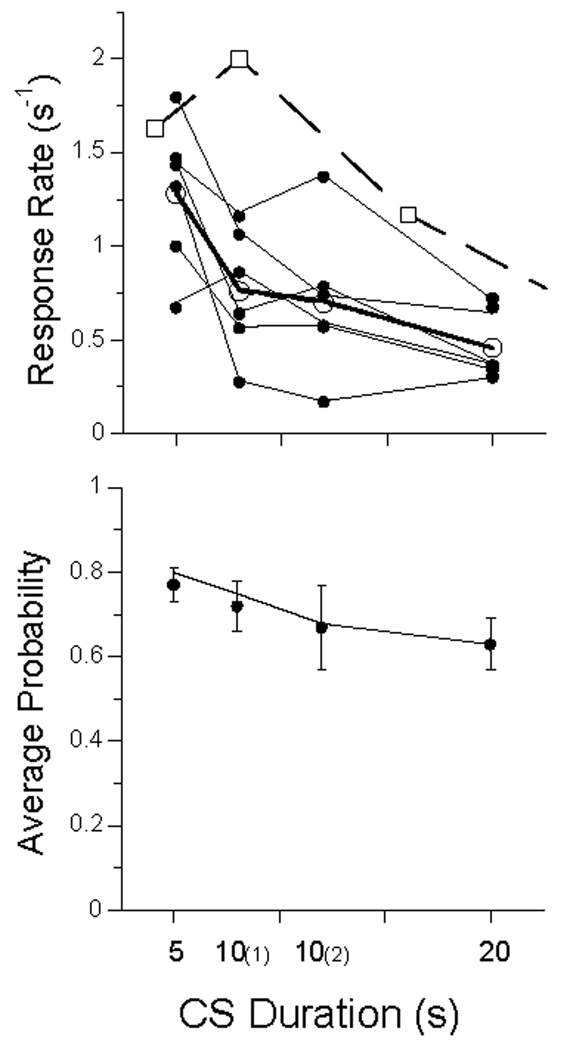
Figure 9.
Data from Experiment 2. Top Panel: average response rate (dots) for each subject. Open circles gives average rate, and squares represent data from Perkins and associates (1975). Bottom panel: Average probability of making at least one response on a trial averaged over pigeons; bars give standard errors. Unbroken lines in both panels are from the MPS model.

