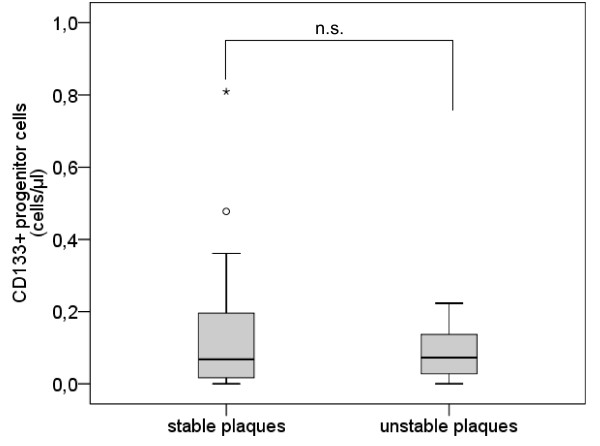
Figure 3.
Number of CD133+ progenitor cells. Boxplot demonstrating the number of CD133+ progenitor cells (/μl) in subjects with stable plaques and subjects with unstable plaques. The top of the box represents the 75th percentile, the bottom of the box represents the 25th percentile, the center horizontal line represents the 50th percentile. The whiskers represent the highest and lowest values that are not outliers or extreme values. Outliers (between 1.5 and 3 times the interquartile range) are represented by circles and extreme values (more than 3 times the interquartile range) by asterisks.

