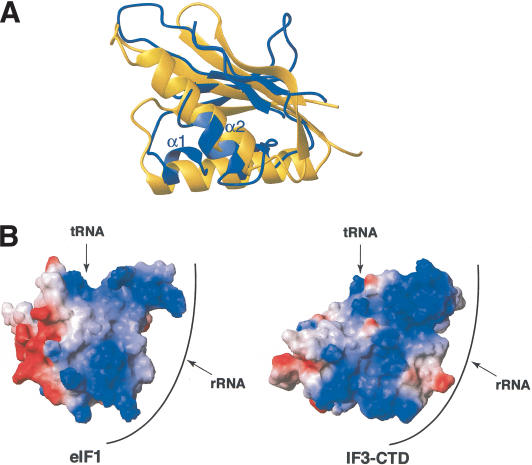
Figure 7.
Superposition of eIF1 and the C-terminal domain of IF3 (IF3-CTD). (A) Superposition of structural elements of eIF1 (blue ribbon) and the IF3-CTD (yellow ribbon; Biou et al. 1995), based on their positions on the small ribosomal subunit (Dallas and Noller 2001; this study). The orientation of eIF1 is as in Figure 6. (B) Comparison of the surface charge distribution of eIF1 and IF3-CTD based on their positions on the small ribosomal subunit (Dallas and Noller 2001; this study). Positively and negatively charged surfaces are blue and red, respectively. Both eIF1 and IF3-CTD are rotated 180° compared with panel A. The extensive rRNA-binding surface (front) and the tRNA contact surface (top) are indicated. The solvent-exposed surface facing the ribosomal E-site is on the left.

