Figure 5.
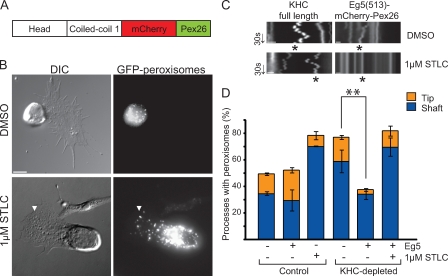
Eg5 restores dynein-driven transport. (A) Schematic of Eg5(513)–mCherry-Pex26. Dimeric Xenopus Eg5 encodes the head, neck-linker, and first coiled-coil domains (amino acids 1–513). Dimeric Eg5 was cloned into the mCherry-Pex26 peroxisome-targeting vector. (B) Eg5(513)–mCherry-Pex26 expression results in peroxisome clustering at the cell center. S2 cells plated in the presence of CytoD and stably transfected with Eg5(513)–mCherry-Pex26 in an endogenous KHC-depleted background. (bottom) Plated in the presence of 1 µM STLC for 2 h. Arrowheads highlight location of a single peroxisome within a process. DIC, differential interference contrast. (C) Kymographs of GFP-labeled peroxisomes present along the length of a single process. Kymographs were derived from S2 cells expressing either full-length KHC (left) or Eg5(513)–mCherry-Pex26 (right) in an endogenous KHC-depleted background. Cells were plated in the presence of either DMSO (top) or 1 µM STLC (bottom). Asterisk indicates the track of a single peroxisome over the course of 1 min. Arrows delineate time (30 s). (D) Quantitative representation of results showing changes in the distribution of peroxisomes along processes before and after KHC depletion and expression of Eg5(513)–mCherry-Pex26. Data represent mean values ± SD from 120 cells per condition (from three separate dsRNA treatments). Asterisks indicate statistical significance using the Student’s t test. Bars: (B) 5 µm; (C) 1 µm.

