Figure 1.

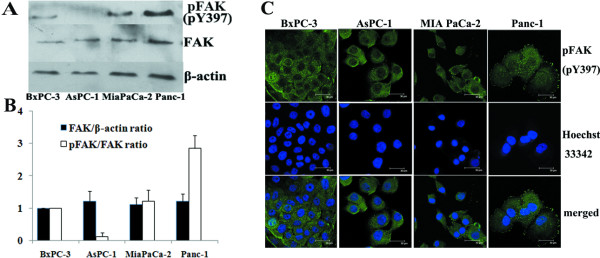
Constitutive phosphorylation of FAK at Tyr397 in pancreatic cancer cells. A, Western blot analysis was performed to determine the constitutive level of total FAK and pFAK (pY397) expression in BxPC-3, AsPC-1, MiaPaCa-2 and Panc-1 cells. Equal protein loading was confirmed by β-actin. This figure shows a representative blot of an experiment performed in triplicate. B, For semiquantitation, the intensities of FAK, pFAK and β-actin bands for each cell line were calculated using a densitometer. Bars are mean ± SE of relative FAK/β-actin or pFAK/FAK ratio (normalized to that for BxPC-3 cells, which was given a value of 1) for three independent experiments. C, Confocal microscopy images of the four pancreatic cancer cell lines showing constitutive expression of pFAK (pY397; green) to evaluate FAK phosphorylation status. The same fields stained with Hoechst 33342 (blue) to indicate the position of nuclear DNA are shown in the middle panels and the merged images are shown in the bottom panels.
