Figure 2.
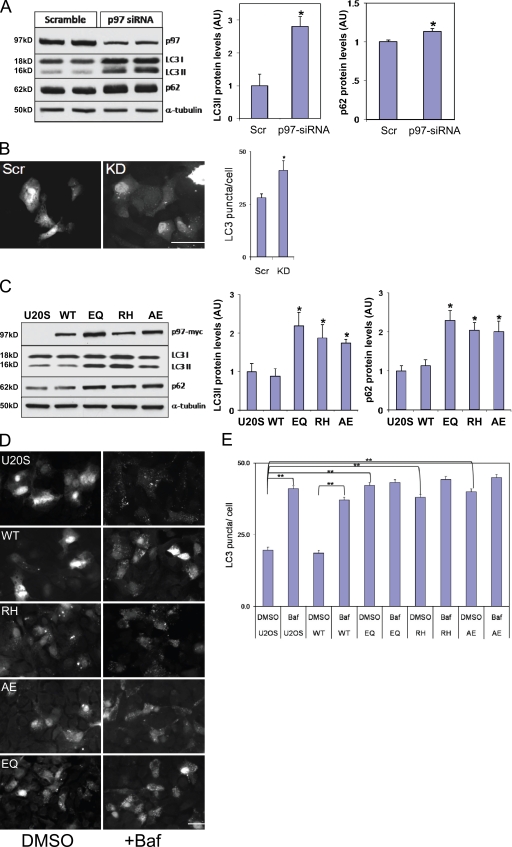
LC3 and p62 accumulate in VCP-KD and IBMPFD mutant–expressing cells. (A) Lysates from scrambled siRNA or VCP-targeted siRNA–treated U20S cells immunoblotted with antibodies to VCP, LC3, p62, or α-tubulin. Densitometric analysis is graphically represented from four independent experiments. LC3 and p62 levels are normalized to loading control. (B) Fluorescent microscopy images of siRNA scrambled control (Scr) or VCP-targeted siRNA KD cells expressing GFP-LC3. Basal numbers of GFP-LC3 puncta/cell were counted. (C) Lysates from control or myc-tagged VCP-WT, ATPase-inactive VCP-EQ, or one of two IBMPFD mutants, VCP-RH or -AE, expressed for 16 h from stably transfected tetracycline-inducible U20S cells and immunoblotted with antibodies to myc, LC3, p62, or α-tubulin. Densitometric analysis is graphically represented from four independent experiments. LC3 and p62 levels are normalized to loading control. Note the increase in LC3II and p62 in VCP siRNA KD and mutant-expressing cells. (D) Fluorescent microscopy images of tetracycline-inducible U20S cells expressing GFP-LC3 treated with and without Baf for 4 h (DMSO control [left] or Baf+ [right]). Cells are control U20S cells and VCP-WT, -RH, -AE, and -EQ. (E) The number of GFP-LC3 puncta/cell was counted for control U20S and VCP-WT, -EQ, -RH, and -AE with and without Baf for 4 h (DMSO or Baf). Note the increase in basal GFP-LC3 puncta in mutant-expressing cells. (A–C and E) Error bars represent the standard error from four independent experiments. *, P < 0.01; and **, P < 0.001. Bars, 25 µm.

