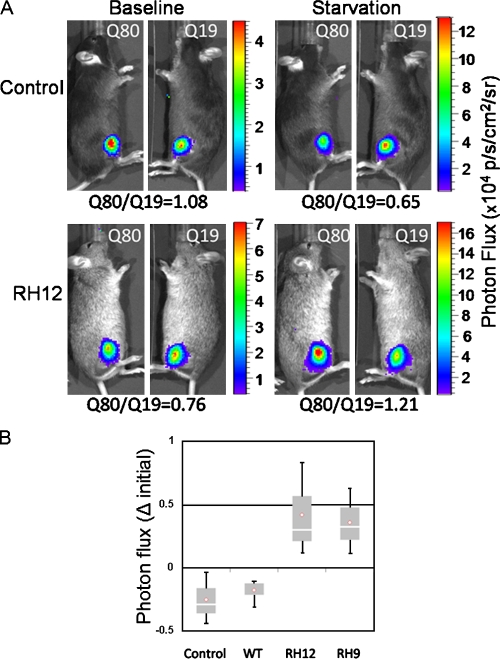
Figure 7.
Impaired autophagic substrate degradation in IBMPFD mouse muscle. (A) Representative images using in vivo bioluminescence of control or IBMPFD mutant RH–expressing mice (RH12) 2 d after electroporation (baseline) or after 24 h of nutrient deprivation (starvation) of polyQ80 (Q80)- or polyQ19-luciferase (Q19) in the right and left tibialis anterior, respectively. The ratio of polyQ80-luciferase/polyQ19-luciferase is indicated below each image set. Values are in ×104 photons per second per square centimeter per steradian. (B) Box and whisker plot of the change (Δ) in the ratio of polyQ80-luciferase/polyQ19-luciferase activity in the left and right tibialis anterior muscle of control, VCP-WT, or one of two VCP-RH (RH12 or RH9) transgenic mouse lines after 24 h of starvation. The graph is representative of three animals per group. The p-value for RH12 was 0.05 and 0.06 when compared with control animals or VCP-WT transgenic. The p-value for RH9 was 0.03 when compared with either control or VCP-WT transgenic. The p-value was 0.01 and 0.02 when combined RH12 and RH9 animals were compared with control or VCP-WT groups, respectively. There was no statistical difference between control or VCP-WT groups.

