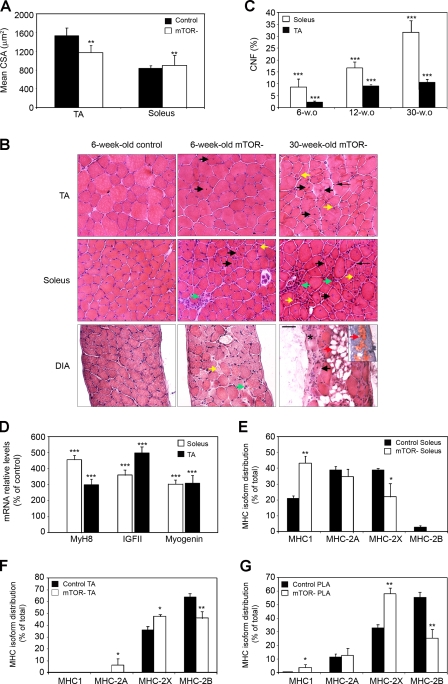
Figure 2.
mTOR− mice develop a progressive MD. (A) Analysis of the mean fiber CSA in TA and soleus muscles from 6-wk-old mice (n = 4). (B) H&E-stained transverse sections of TA, soleus, and diaphragm (DIA) muscles from control and mTOR− mice. Degeneration with phagocytosis and mononuclear cell infiltration (green arrows), variation in fiber size with small atrophic fibers (yellow arrows), interfiber connective tissue (thin arrows), regenerated muscle fibers with centrally located nuclei (black arrows), fibrosis (asterisk), and fatty infiltration (red arrows) are shown. Adipogenic differentiation was confirmed by oil red O staining as shown in the inset. Bar, 50 µm. (C) Percentage of centrally nucleated fibers (CNF) increases with age in mTOR− muscles. (D) Relative mRNA levels of MyH8, IGF-II, and myogenin in mTOR− muscles from 6-wk-old mice. (E–G) Graphs show the percentage distribution of MHC isoforms I, 2B, 2X, and 2A in soleus (E), TA (F), and PLA (G) muscles from 6-wk-old control and mTOR− mice. (C–G) n = 5 sample sets. *, P < 0.05; **, P < 0.01; ***, P < 0.001. Data indicate mean ± SEM.

