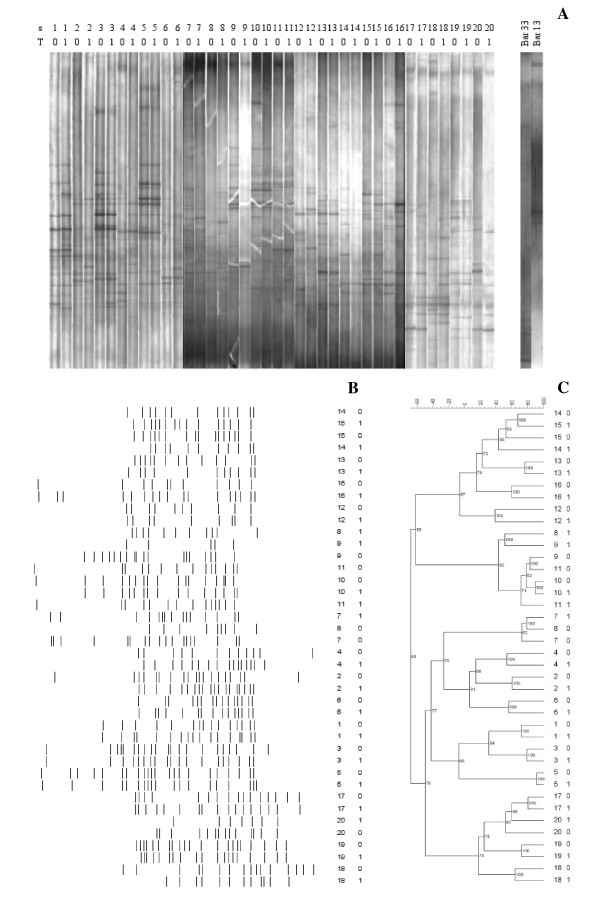
Figure 1.
DGGE analysis of the fecal samples recovered from 20 healthy volunteers (s1-s20) before (T0) and after (T1) one month of the synbiotic intake. A: DGGE profiles related to fecal samples and L. helveticus Bar13 and B. longum Bar33 probiotic strains. B: line graph. C: Cluster analysis (Pearson correlation was used to calculate the similarity in DGGE profiles).

