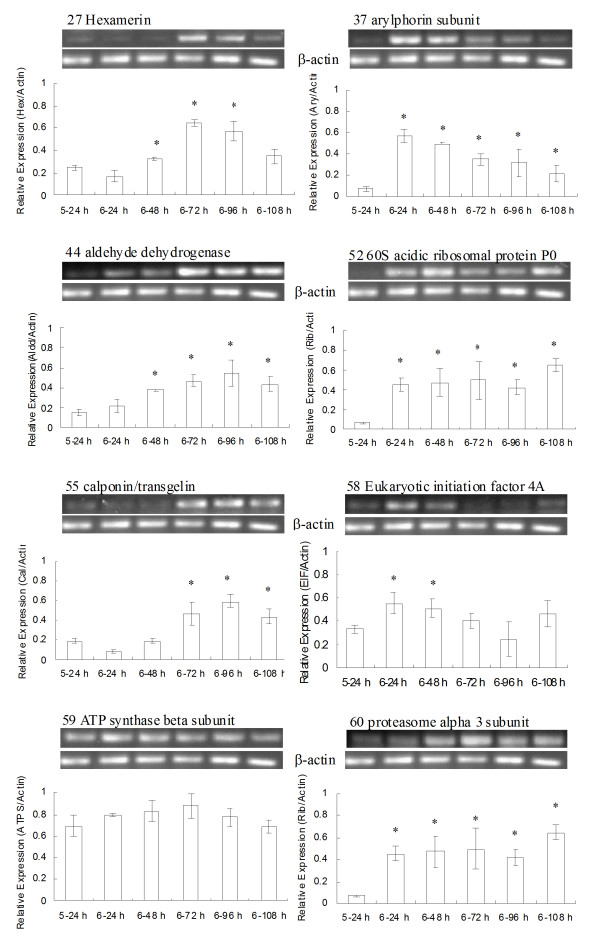
Figure 3.
Reverse Transcription PCR analysis of transcription of genes encoding proteins identified in 2D-electrophoresis. Total RNA was isolated from 5th-feeding (5-24 h), 6th-feeding (6-24 h, 6-48 h), and 6th-metamorphically committed (6-72 h, 6-96 h, 6-108 h) larval epidermis. The β-actin gene was used for normalization of the compared templates. The gene expression ratio was calculated by Quantity One (Version 4.5, Bio-Rad, United States). All of the experiments were repeated at least three times. The values are mean ± standard deviation obtained by normalization of target genes against β-actin (*, difference is significant compared to 5-24 h by student t test, p < 0.05).

