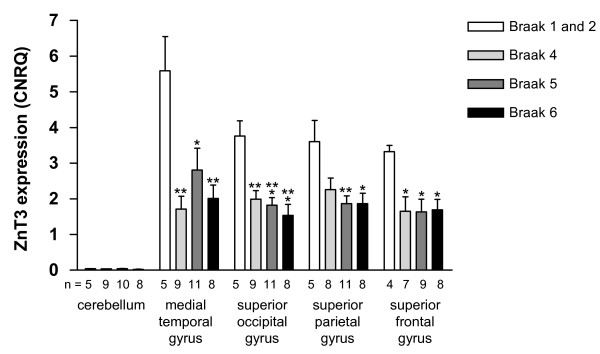
Figure 2.
ZnT3 expression in AD and control brain tissue. RNA was isolated from the pm brain tissue regions indicated and reverse transcribed prior to qPCR analysis in triplicate, and data analysis using qBase Plus, as described in the Methods section. Columns represent the mean ZnT3 expression level (expressed as CNRQ) ± SEM for each Braak stage, and the numbers at the base of each column (n) indicate the number of individuals included in that analysis. Statistical analysis (one-way ANOVA and Tukey-Kramer multiple comparisons test) revealed significant differences between control ZnT3 expression levels (Braak stages 1 and 2), and ZnT3 expression levels in the AD brain tissue (Braak stages 4, 5, and 6): * p < 0.05; ** p < 0.01; *** p < 0.001 compared to control ZnT3 expression in the same brain region.

