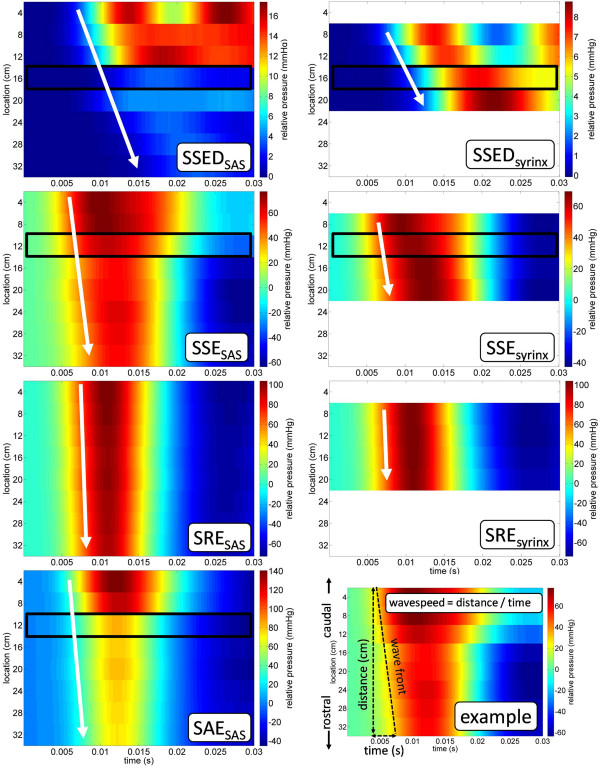
Figure 7.
Spatial versus temporal pressure distribution for each model in the SAS and syrinx. Each black box indicates a pressure measurement obtained from a sensor located at a stenosis. Slope of the white arrows indicates the direction and approximate speed of the pressure wave propagation. The example (bottom right) provides a visual interpretation of the wave speed calculation technique. Note: full coughing pressure data set has been truncated temporally to visualize the foot of pressure wave arrival. SSED, SAE, SSE, and SRE as for Figure 1.

