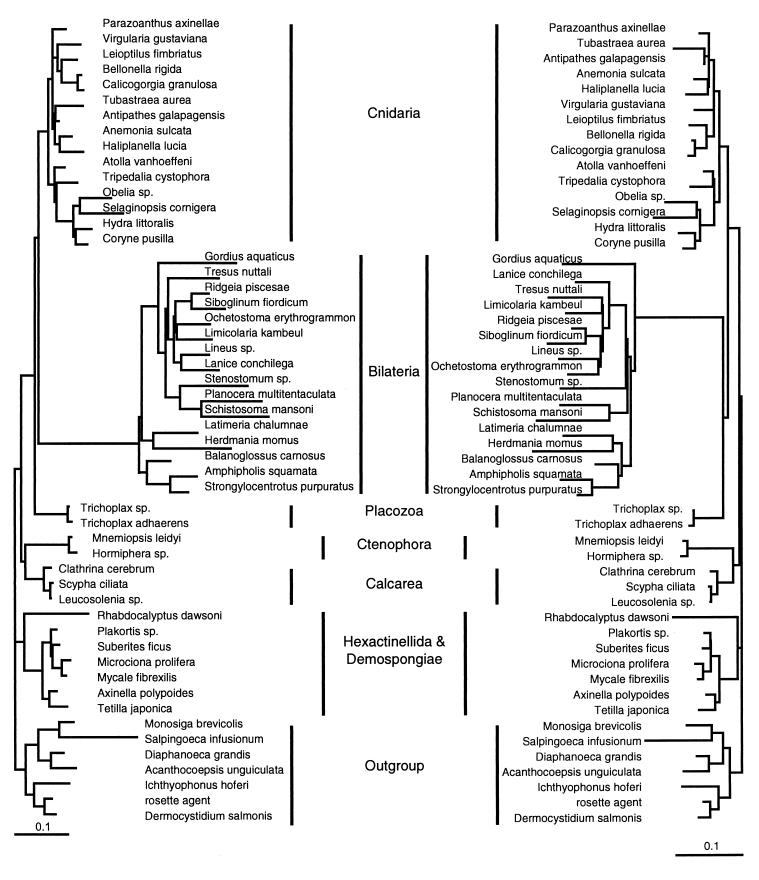
Figure 3.
Optimal trees under the criteria of maximum likelihood (Left) and minimum evolution (Right). In both analyses the HKY85 model of nucleotide evolution was used with a gamma shape parameter of 0.3365. The maximum likelihood analysis included an assumed transition-to-transversion ratio of 1.643.

