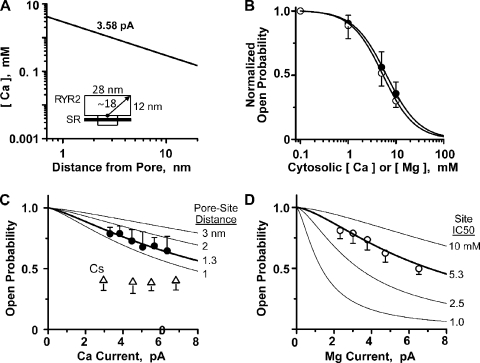
Figure 2.
Flux-dependent inhibition of single RYR2 channel activity. (A) Local diffusion from a point source here was calculated with cytosolic Ca2+ of 100 nM in the presence of different unit Ca2+ currents. The thick line is for 3.58 pA, reflecting the typical unit current we measure when there is 50 mM of luminal Ca2+ present. (Inset) A cartoon depicting the approximate dimensions of a single RYR2 channel. (B) Cytosolic Ca2+ (filled circles) or Mg2+ (open circles) inhibition of single RYR2 channels activated by 100 µM of cytosolic free Ca2+. Experiments here were done at 0 mV. Cytosolic Ca2+ or Mg2+ was changed from 100 µM to 10 mM. Lines are Hill equation fits. The Ca2+ and Mg2+ IC50’s were 6.2 ± 0.34 mM (Hc = −1.3) and 5.3 ± 0.69 mM (Hc = −1.5), respectively. Results represent data collected from five to eight different channels. The cytosolic solution also contained Tris-HEPES (120/250 mM; pH 7.4). The luminal solution contained 5 µM of added Ca2+ and 100 mM Cs-HEPES, pH 7.4. (C) Luminal-to-cytosolic Ca2+ flux dependence of Po. These results represent data collected from six to nine RYR2 different channels. The cytosolic free Ca2+ was 7 µM, and unit Ca2+ current was varied by changing the membrane potential. Filled circles are Po values with Ca2+ as sole charge carrier. The thick line is a fit using Eq. 4 (described in Materials and methods) to the filled circles revealing a pore site distance of 1.3 nm. This fit assumes the cytosolic Ca2+ inhibition site properties defined in B, and the pore site distance sensitivity of this relationship is illustrated by the labeled thin lines. Open triangles are Po values when Cs+ (instead of Ca2+) was charge carrier. The cytosolic solution contained 1 mM EGTA and Tris-HEPES (as above). When Ca2+ was charge carrier, the luminal solution contained Ca-HEPES (50/250 mM; pH 7.4). When Cs+ was charge carrier, the luminal solution contained 5 µM of added Ca2+ and 100 mM Cs-HEPES, pH 7.4. (D) Luminal-to-cytosolic Mg2+ flux dependence of Po. These results represent data collected from seven to eight RYR2 channels. Again, cytosolic free Ca2+ was 7 µM, and unit Mg2+ current was varied by changing the membrane potential. The thick line is fit using Eq. 4 and indicates a pore site distance of 1.1 nm. This fit assumes the cytosolic Mg2+ inhibition site properties defined in B, and the IC50 sensitivity of this relationship is illustrated by the labeled thin lines. The cytosolic solution also contained 1 mM EGTA and Tris-HEPES (as above), and the luminal solution contained Mg-HEPES.

