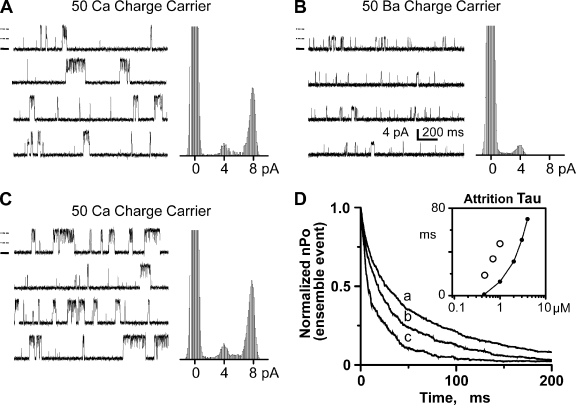
Figure 5.
Flux-dependent coordinated RYR2 channel activity. (A) Sample coordinated channel recordings (two channels present) and all-points histogram. The cytosolic solution contained 1 mM EGTA (0.45 µM of free Ca2+) and Tris-HEPES (120/250 mM; pH 7.4). The luminal solution contained Ca-HEPES (50/250 mM; pH 7.4). Recordings (left) were made at 0 mV. Open events are upward, and zero current level is marked for the top recording by a thick solid line. The thin dashed lines (above zero current mark) indicate normal current level for one or two open channels. All-points histograms (right) were made from a long recording from which these sample recordings were taken. (B) Same channel and conditions as in A, but the 50 mM Ca2+ in the luminal solution was exchanged for Ba2+. (C) Same channel and conditions as in B, but the 50 mM Ba2+ in the luminal solution was changed back to Ca2+. (D) Ensemble traces were generated by aligning and summing many individual coordinated events (two channel events). Only the decay phase is shown here. Solutions are those described for A, except that the cytosolic free Ca2+ level was varied as indicated below. Trace marked “a” has a time constant of 47.49 ms and was generated from 2,308 events collected with 1 µM of cytosolic free Ca2+ present. Trace marked “b” has a time constant of 33.65 ms and was generated from 1,252 events collected with 0.7 µM of cytosolic free Ca2+ present. Trace marked “c” has a time constant of 18.62 ms and was generated from 792 events collected with 0.45 µM of cytosolic free Ca2+ present. The inset plots attrition time constants (ms) as a function of cytosolic free Ca2+ concentration (µM). Open circles are the time constants determined by single-exponential fits to the ensemble traces. The connected filled points are the predicted stochastic attrition calculated using Eq. 1, assuming two channels are present. This calculation assumes the single-channel Po’s as shown in Fig. 1 B and single-channel MOTs as shown in Fig. 3 D (inset). For example, single-channel Po’s were 0.03, 0.09, and 0.19 for 0.45, 0.7, and 1 µM of cytosolic free Ca2+, respectively. Single-channel MOTs for these same Ca2+ levels were 1.04, 6.86, and 11.46 ms, respectively.

