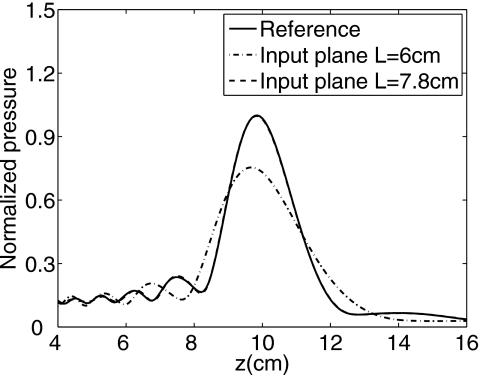
Figure 7.
Axial pressures simulated with the angular spectrum approach using input pressure planes that are truncated by square windows of different sizes. The reference pressure is indicated by the solid line, the output pressure computed with the angular spectrum approach using a 6 cm×6 cm (40λ×40λ) input pressure plane is represented by the dash-dot line, and the axial pressure computed with the angular spectrum approach using a 7.8 cm×7.8 cm (52λ×52λ) input pressure plane is represented by the dashed line. The solid line and the dashed line are nearly coincident, which indicates that L=7.8 cm (L=52λ) is sufficiently large for the 7.31 cm×7.31 cm phased array in Fig. 2.

