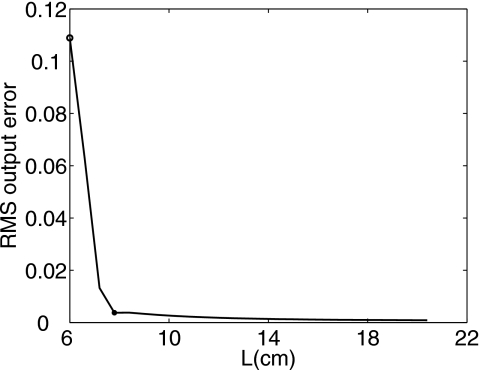
Figure 8.
RMS output errors plotted as a function of the extent L of the input pressure plane. The input pressure plane for angular spectrum simulations is located at z0=0.15 cm (z0=λ) and truncated by L×L square windows, where L ranges from 6 cm (40λ) to 20.4 cm (136λ) with an increment of 0.15 cm (λ). The two markers indicate the values of L shown in Fig. 7.

