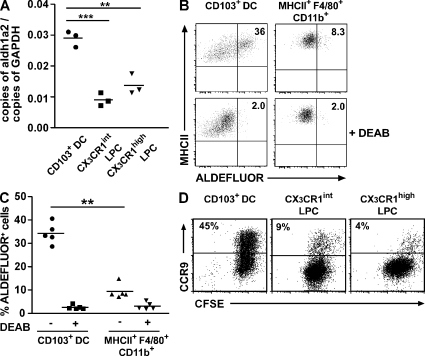
Figure 7.
CX3CR1+ LPCs display weak ALDH activity and fail to efficiently induce CCR9 on responding CD8 T cells. (A) Aldh1a2 expression of sorted CD103+ DC, CX3CR1int LPC, and CX3CR1high LPC was assessed by real-time PCR. The mean (horizontal lines) was obtained from three separate experiments using pooled cells from five to eight mice per experiment. Results were obtained with an unpaired Student's t test. **, P < 0.01; ***, P < 0.001. (B and C) ALDH activity on sorted CD103+ DC and MHCII+F4/80+CD11b+ LPC with or without addition of inhibitor. (B and C) Representative stainings (B) and mean (C; horizontal lines) of five individual mice (symbols). Results were obtained with a paired Student's t test. **, P < 0.01. (D) CFSE-labeled OT-I cells were co-cultured with peptide-loaded CD103+ DC, CX3CR1high LPC, or CX3CR1int LPC at a ratio of 2:1 for 3.5 d and expression of CCR9 on responding OT-I cells was analyzed. Results are representative of two experiments.

