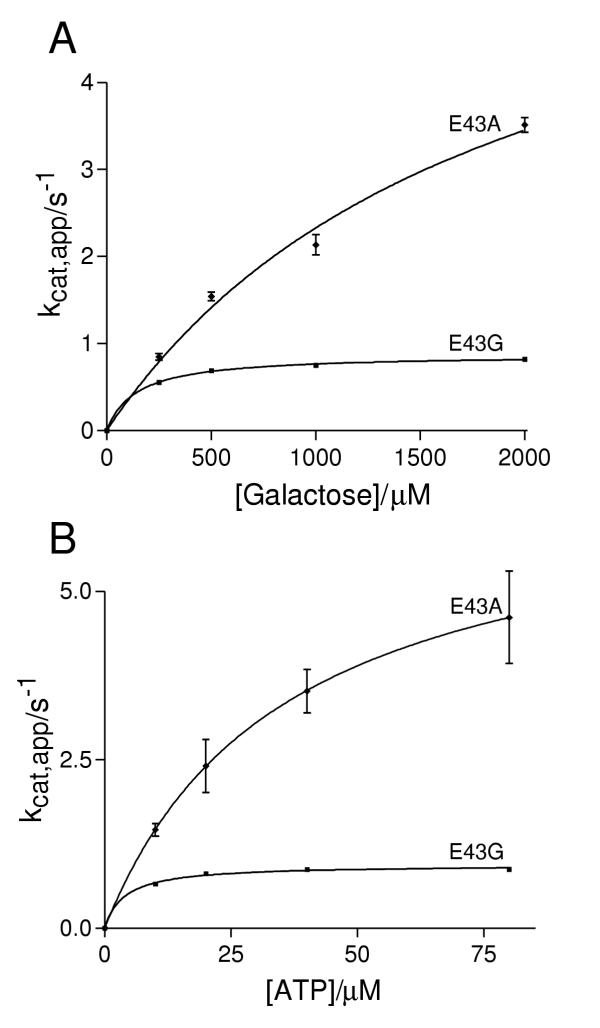
Figure 4.
Kinetic analysis of the soluble mutants, E43A and E43G. Error bars represent the standard error as derived from the non-linear curve fitting (see materials and methods). The kinetic parameters derived from these curve fits are detailed in table 1.

