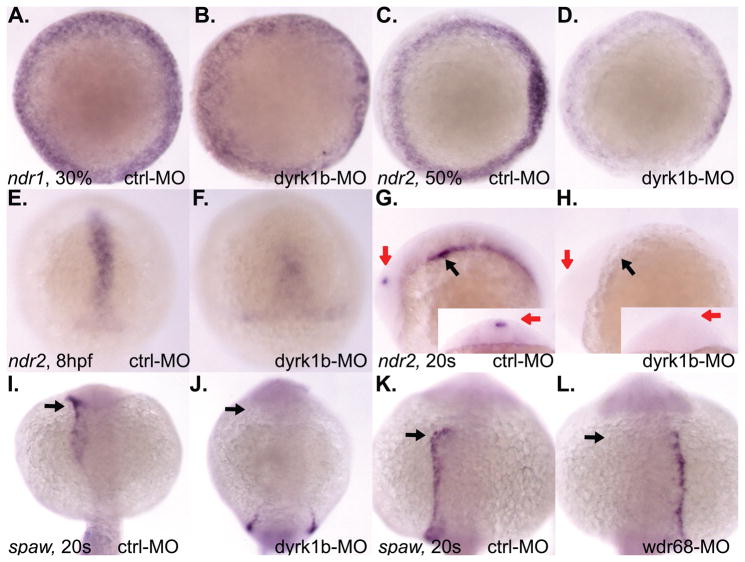
Figure 5. dyrk1b and wdr68 are important for ndr2 and spaw expression in the zebrafish.
A) dorsal view of normal ndr1 expression in control animals at 30% epiboly stage. B) normal ndr1 expression in dyrk1b-MO animals at 30% epiboly stage. C) A) normal ndr2 expression in control animals at 50% epiboly stage. D) reduced ndr2 expression in dyrk1b-MO animals at 50% epiboly stage. E) shield view of normal ndr2 expression in control animals at 8hpf. F) reduced ndr2 expression in dyrk1b-MO animals at 8hpf. G) normal asymmetric ndr2 expression in control animals at 20 somites stage. Black arrow indicates asymmetric expression in lateral plate mesoderm. Red arrows indicate asymmetric expression in diencephalon. Red arrow in inset image is on left side of animal. H) reduced ndr2 expression in dyrk1b-MO animals at 20 somites stage. I) dorso-posterior view of normal asymmetric spaw expression in control animals at 20 somites stage. J) reduced expression of spaw in dyrk1b-MO animals at 20 somites stage. K) dorsal view of normal asymmetric spaw expression in control animals at 20 somites stage. L) loss of asymmetry in the expression of spaw in wdr68-MO animals at 20 somites stage.

