
Figure 5. When combined, Δ9-THC and CBD produce an increase in activation of p8 and multiple caspases.
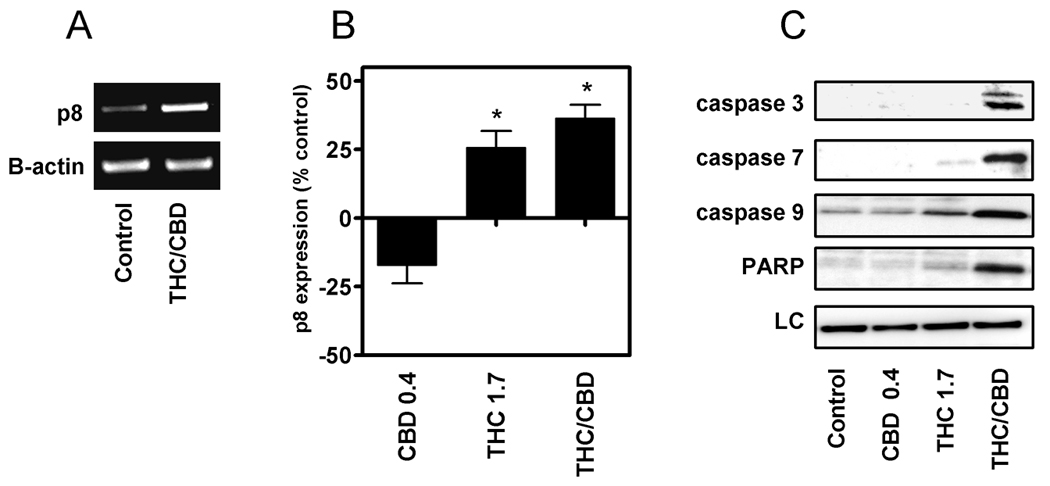
The effects of cannabinoids on p8 and caspase expression were analyzed using semi-quantitative RT-PCR and Western analysis, respectively. RNA and protein were collected from U251 cells treated for three days with CBD (0.4 µM), Δ9-THC (1.7 µM), or a combination of Δ9-THC (1.7 µM) and CBD (0.4 µM). A) RT-PCR was run on RNA extracted from control-treated and Δ9-THC/CBD-treated samples. Expression of the β-actin gene product was used as a control for equal loading. B) Data are represented as percentage p8 expression of the treated cells/control cells ×100 and all values were normalized against β-actin. Blots and PCR reactions are representative of at least 3 independent experiments. Data were compared using a one-way ANOVA with a Dunnett’s multiple comparison post-hoc analyses. (*) indicates statistically significant differences from control (p<0.05). C) Proteins were extracted from treated cells and analyzed for cleaved caspase 3, 7, 9 and PARP expression.