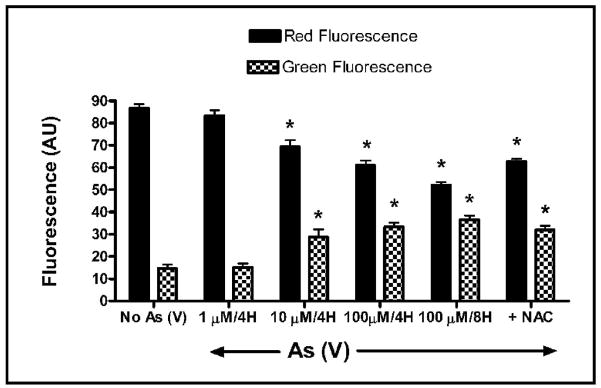
Fig. 7.
Analysis of mitochondrial membrane potential (δψm) in MEMM cells treated with As (V). MEMM cells in suspension were treated with 0, 10 or 100 μM As (V) for 4 hours or with with 100 μM As (V) for 8 hours (positive control), before being labeled with 100 nM of mitochondria selective dye JC-1 (see Methods). One set of cells in suspension was pretreated with NAC prior to treatment with 100 μM As (V). Fluorescence intensity was analyzed utilizing the cell fluorescence module of the Agilent 2100 Bioanalyzer. Mean values ± S.E. from three separate experiments were plotted. A significant (*p<0.05) dose-dependent increase in green fluorescence and decrease in red fluorescence was apparent and most prominent in cells treated with 100 μM As (V) for 8 hrs. Alterations in red and green fluorescence in NAC + As (V) treated cells were significantly different from cells treated with As (V) for 8 hrs (*p<0.05) but were not significantly different from cells treated with As (V) for 4 hrs.

