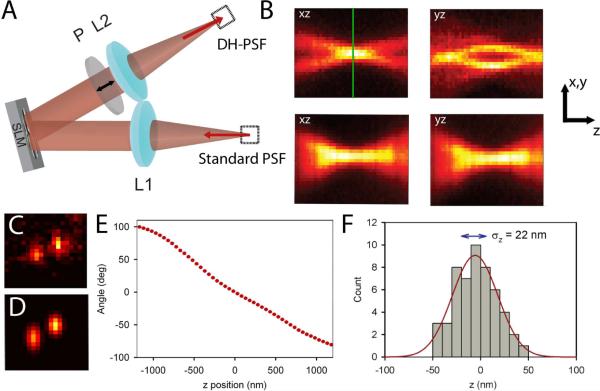
Figure 1.
Schematic and experimental characterization of the DH-PSF imaging system. (A) Schematic of the 4f setup that is attached to the detection path of a standard inverted microscope. See text for details. (B) Top panels are the xz and yz cross sections of the experimentally observed DH-PSF using a 200 nm fluorescent bead. For comparison, the same cross sections taken of the standard PSF of a conventional microscope are also shown in the lower panels. The green line indicates the focal plane, denoted as z = 0 in this paper. Note the gradual change of the standard PSF with z compared with the more dramatic change of the DH-PSF throughout the depth of field. The arrows correspond to scale bars that are 2 μm long in x–y and 700 nm long in z. The z axis has been lengthened for clarity. (C) Image of a single DCDHF-2V molecule in PMMA taken using the DH-PSF system. This molecule emitted on average 3100 photons per acquisition on top of a background noise of 16 photons/pixel per acquisition. (D) Output of the fitting algorithm for the data shown in (C). The fitting algorithm used in this paper fits the DH-PSF as the sum of two Gaussian functions. (E) A plot of the angle between the two lobes as a function of z position of the emitter that is used as a calibration curve. This curve was taken using a bright 200 nm fluorescent bead. (F) Histogram of 50 localizations in z of the molecule shown in (C) with a Gaussian fit shown in red. The localization precision, which is the standard deviation of the distribution, is explicitly shown on the plot.

