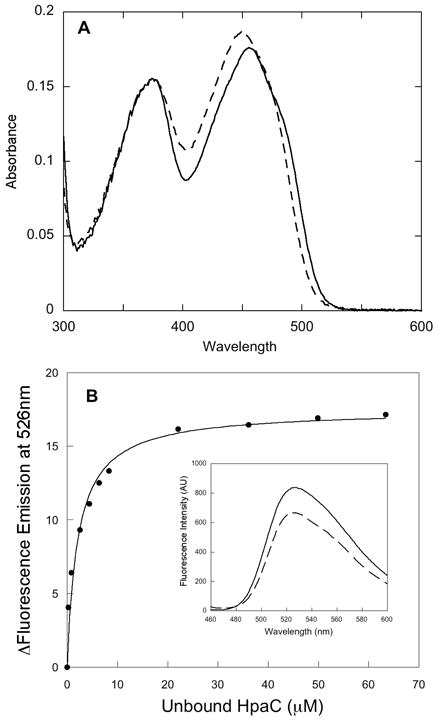
Figure 1.

Spectral analysis of the reductase component of HPAH from P. aeruginosa. A - Spectrum of HpaC in buffer (solid line) and after addition of SDS to dissociate FAD from the protein (dashed line). B - Fluorimetric titration of FAD with apo-HpaC at 4 °C. A solution of 4.5 μM FAD in 50 mM K phosphate buffer, pH 7.2 was titrated with aliquots of concentrated apo-HpaC (0.13 mM), and fluorescence emission spectra were recorded with excitation at 450 nm. Free (or unbound) HpaC was measured by taking the difference between measured bound HpaC and total HpaC. Changes in fluorescence emission intensity were plotted against the concentration of unbound HpaC in solution. The data were fitted to a hyperbolic equation (solid line in B) to obtain the Kd for FAD of 3 μM. The inset shows the spectrum of the free FAD (solid line) and that of the final titration point after adding 68 μM HpaC (dashed line).
