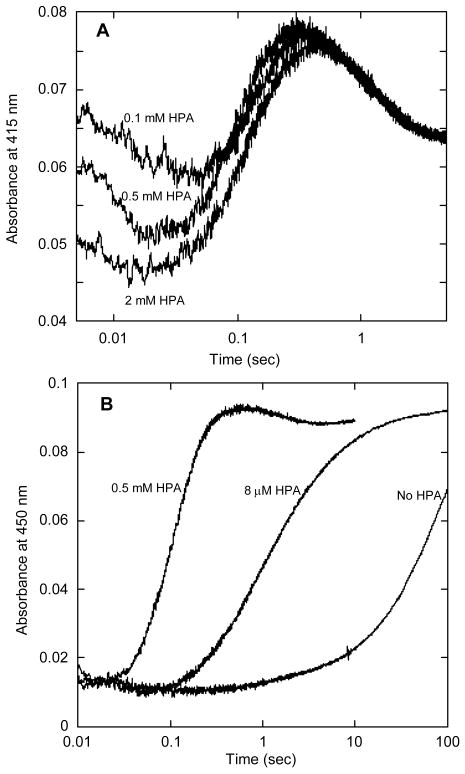
Figure 5.
Kinetic traces observed upon reaction of HPA with the oxygenase in the form of the flavin-C4a-hydroperoxide. This experiment was performed with a double-mix stopped-flow spectrophotometer. In the first mix, HpaA with FADH− was reacted with oxygen under the same conditions as described in the legend to Fig. 2 to form the flavin-C4a-hydroperoxide. Then, in the second mix, this component was reacted with different concentrations of HPA. There were no observable differences due to using aging times ranging from 50 ms to 10 s. The reaction after the second mix contained 7.5 μM FAD, 20 μM oxygenase, 440 μM oxygen, and various concentrations of HPA in 50 mM K phosphate buffer containing 2.5% glycerol at pH 7.2 and 4° C. A – Reaction traces recorded at 415 nm using the concentrations of HPA indicated on the figure. Note the similarity to the reaction trace at 415 nm in figure 3A. Three phases showed some dependence on HPA concentration (see text). B – Reaction traces recorded at 450 nm. The reaction with 0.5 mM HPA has similar kinetics to the traces in A. The reaction with an approximately stoichiometric concentration of HPA (8 μM) shows that at this concentration of HPA, binding is comparatively slow and limits the reaction rate for forming oxidized FAD.

