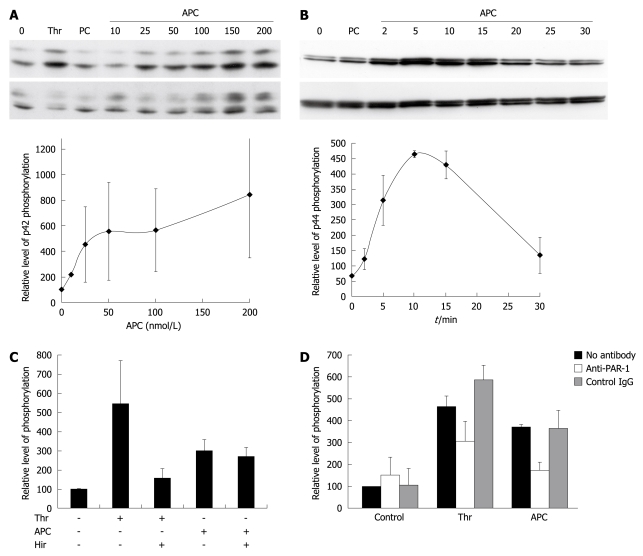
Figure 2.
Effect of activated protein C (APC) on extracellular signal-regulated kinase (ERK) phosphorylation. A: Dose-response of APC. Cells were exposed for 10 min to 27 nmol/L thrombin (Thr), 100 nmol/L nonactivated protein C (PC), or APC. ERK phosphorylation was assessed using Western blotting. The upper panel shows a blot labeled with an antibody to phospho-ERK, and the lower panel shows the same blot re-hybridized with an antibody to total ERK. The graph shows the quantification of p42 phosphorylation in three similar independent experiments. Results are shown as mean ± SE. Phospho-p42 signals were normalized first to total p42 signals, and the results were expressed as a percentage of the non-stimulated control. Similar results were obtained when quantitating p44 phosphorylation; B: Kinetics of APC induced phosphorylation of ERK. Cells were exposed to 100 nmol/L APC. The upper panel shows a blot labeled with an antibody to phospho-ERK, and the lower panel shows the same blot re-hybridized with an antibody to total ERK. The graph shows the quantification of p44 phosphorylation in three similar independent experiments. Phospho-p44 signals were normalized first to total p44 signals, and the results were expressed as a percentage of the non-stimulated control. Similar results were obtained when quantitating p42 phosphorylation; C: APC effect is not due to contaminating thrombin. Cells were exposed for 10 min to 27 nmol/L Thr or 100 nmol/L APC. They were pretreated with or without hirudin. The graph shows the quantification of combined ERK1/ERK2 phosphorylation in four similar independent experiments; D: APC signals through PAR-1. Cells were exposed for 10 min to 27 nmol/L Thr or 100 nmol/L APC. They were preincubated with the indicated antibodies. The graph shows the quantification of combined ERK1/ERK2 phosphorylation in three similar independent experiments.

