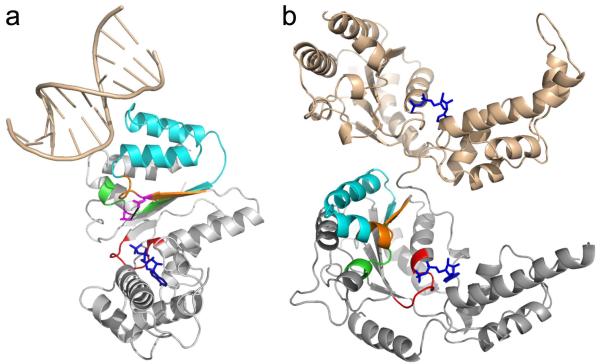
Figure 4. Link between the glutamate switch motif and ligand binding site.
(a) Glutamate switch pair location within a typical AAA+ domain and the linkage to the ligand binding site. The example shown is A.pernix ORC1 DNA complex (Clade 2, PDB ID code 2V1U). The Walker A motif is shown in red, the glutamate switch region in orange (with the E-N pair in magenta), the ligand binding site between the glutamate switch and the DExx box in cyan, the DExx box in green and the bound ADP in blue. A portion of the bound DNA is shown in wheat.
(b) D1 (wheat) and D2 (grey) domains of p97 (PDB ID code 3CF3) showing the interaction between the two ATPase domains in a type II AAA+ protein. The colouring of the D2 domain follows the same scheme as part (a).

