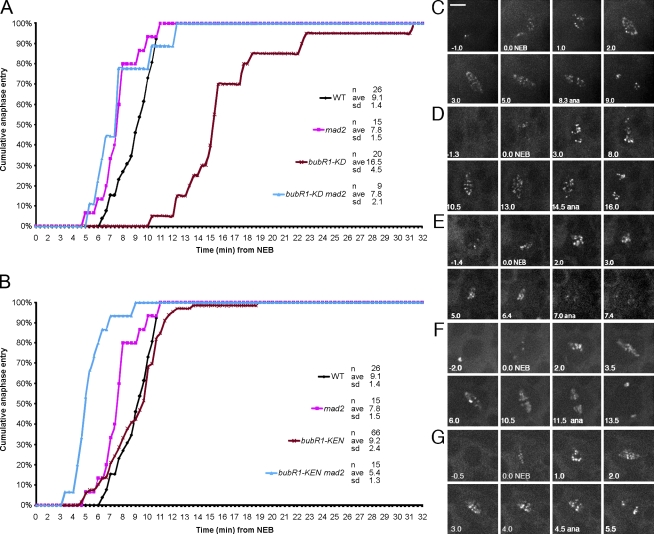
Figure 3.
Mitotic timing in bubR1-KD, bubR1-KEN, and double mutants with mad2. (A) Comparative mitotic transit times for WT, bubR1-KD, mad2, and bubR1-KD mad2 double mutants. bubR1-KD cells are profoundly delayed, averaging 16.5 min versus 9.1 min in WT. In mad2 cells, anaphase is, on average, 2 min earlier than in WT (Buffin et al., 2007). bubR1-KD mad2 double mutant cells show the same timing as mad2 alone, revealing that the prometaphase delay in bubR1-KD is SAC dependent. (B) Comparative mitotic timing of bubR1-KEN and bubR1-KEN mad2 double mutant cells. bubR1-KEN cells show no change in timing relative to WT. In contrast, bubR1-KEN mad2 double mutant cells enter anaphase even earlier than mad2 mutant cells alone (5.4 min vs. 7.8 min; P < 0.005). (C–G) Frames from typical videos used to determine mitotic timing (NEB to anaphase [ana]). WT (C), bubR1-KD (D), bubR1-KD mad2 double mutants (E), bubR1-KEN (F), and bubR1-KEN mad2 double mutants (G) are shown. All cells but the one in E are marked with GFP-Rod. The cell in E is marked with GFP–BubR1-KD. See Videos 4, 6, and 7. Bar, 5 µm.

