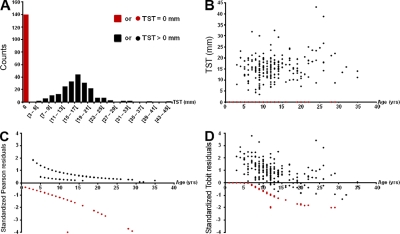
Figure 1.
Distribution of TST according to age among the 350 children used for the linkage analysis before and after adjustment on relevant covariates. (A) Distribution of TST values among the 350 children used for the linkage analysis. A total of 140 subjects had no measurable reaction (red bar) and 210 subjects had TST induration > 0 mm (black bars). (B) Distribution of TST values among the 350 children according to age in years (same color coding as in A). Note that the red dots reflect variable numbers of subjects with TST = 0. Overall, 3, 2, 6, 2, 5, 22, 10, 20, 17, 11, 11, 13, 6, 2, 2, and 3 subjects had a TST = 0 at the ages of 1, 2, 3, 4, 5, 6, 7, 8, 9, 10, 11, 12, 13, 16, 19, and 20 yr, respectively. (C) Distribution of the Pearson residuals obtained by logistic regression of TST-BINa on age, sex, and previous TB according to age in years. Color coding indicates those subjects with TST = 0 (red) or TST > 0 (black). As detailed in B, red dots, i.e., subjects with TST = 0, usually represent multiple persons. The two red dot outliers correspond to two subjects with previous TB and TST = 0. (D) Distribution of the residuals obtained by Tobit regression of TST-QTL on age, sex, and previous TB according to age in years. Color coding indicates those subjects with TST = 0 (red) or TST > 0 (black). As detailed in B, red dots, i.e., subjects with TST = 0, usually represent multiple persons. The two red dot outliers correspond to two subjects with previous TB and TST = 0.

