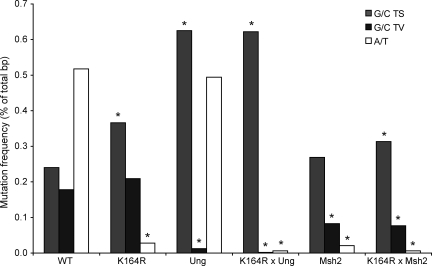
Figure 3.
Absolute frequency mutations grouped into G/C transitions, G/C transversions, and A/T mutations. Absolute mutation frequency of A/T mutations, G/C transitions (TS), and G/C transversions (TV). Values are expressed as the percentage of total sequenced base pairs from mutated clones. The contribution of single nucleotide substitutions is revealed in Fig. S2. Asterisks indicate significant changes compared with WT (χ2 test; all significant changes had a p-value <10−5, and nonsignificant changes had a p-value >0.1). The number of mice analyzed is indicated in Table I.

