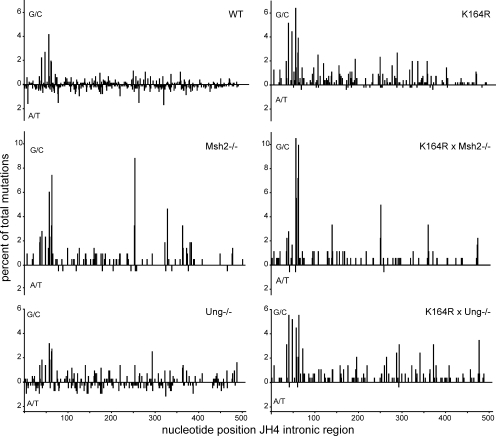
Figure 4.
Mutation distribution in the JH4 intronic region. The distribution of all G/C (above x axis) and A/T (below x axis) mutations along the JH4 intronic region starting from the splice donor are indicated as the percentage of total mutations. The genetic backgrounds are indicated. The number of mice analyzed is indicated in Table I.

